A function is a relationship between two variables. It tells you how the variables work together. Think of functions like a machine that makes cakes. If you put in eggs it will give you cake, if you put in cocoa it will give you chocolate cake. If you put in vanilla, it will give you vanilla cake, if you change the settings, you can get cupcakes instead.
Our functions work in the same way. If we put in one value, our function (which is usually represented as a rule or in a formula) takes that value and manipulates it according to our rule, and then gives us an end product, or another value. We can put in any values, and our function will give us the corresponding output value. We can also try to figure out what our input was, based on the output value that we have been given.
How do we represent functions?
As I mentioned above, functions are usually represented by rules or formulas. But, they can also be represented by flow diagrams, tables, and equations (which are the same as formulae). We can also represent functions with graphs.
What is a flow diagram?
A flow diagram has a series of input values, a box (or several) , that the input values point to, and a series of outputs. We often see more complicated versions of these flow diagrams when we answer questions about whether we should buy something or eat all the chocolate 😉
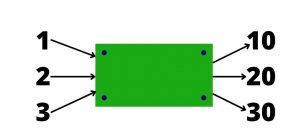
Here is an example of a flow diagram.
This flow diagram on the left shows our input values (1, 2, and 3) and an empty box. On the right it shows the output values (10, 20 and 30).
Can you figure out what was done to the input values to get the output values?
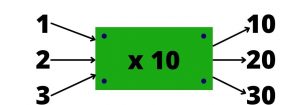
That's right, we multiplied each input value by 10. This step of multiplying by the value of 10 would be considered our function. So we could write it into our box like this:
What is a table?
Now, here we don't mean the thing with four legs that we eat dinner at and do our homework on, we are talking about a grid that shows a pair of values with their headings. Tables represent relationships between our input (often called x), and our output value (often called y).
Here is an example of a table:
x
1
2
3
4
5
y
3
4
5
6
7
This table shows us that we add 2 to each of our x values to get our y values. Our rule is that we add 2 to each value of x. This leads us to formulae and equations.
Formulae and Equations
A formula or equation gives us the recipe for our function or relationship. It tells us what to do to the input value in order to get to our output value. Our equation usually takes the form of y = something happens to x.
A formula usually uses other variables. And it is usually linked to a story or a real-life relationship. So for example, if we want to investigate the relationship between Area and length and breadth. We know that the formula for area is Area = length * breadth. We can write the formula as A = l*b.
So, if we have an area that is equal to 40, we can rearrange our formula so that we have length by itself. This gives us: 40 = l * b.
Now we rearrange the equation so that l is by itself. We do this by dividing by the b. This gives us:
l = 40/b
Now we can substitute values in (our input values) for our b.
So if b = 2 then we have: l = 40/2 = 20
And if b=4 then we have: l = 40/4 = 10
And so on...
This is where our tables come in very handy. We can use our table to write down our input values and the resulting output values. We can then use this table to draw a graph.
Graphs
Our final way to represent relationships and functions is through graphs. When we first start out, the graphs do not focus so much on the individual points, but on the general idea of the relationship. In other words, our graph can tell us whether we have an increasing or decreasing relationship; whether the decrease or increase is constant (the line is straight) or increasing or decreasing itself (when the line is curved). The graph can also tell us if the relationship doesn't change (the line is flat) or if the relationship changes depending where you are in the graph (think of a driving trip - you don't just go fast, you also slow down, or cruise at the same speed, or come to a stop in different parts of your trip).
Now before we get too carried away, I am thinking particularly of line graphs here (yes there are plenty of other graphs, but we usually use them in data handling [which in South Africa we learn about in term 4]).
When we start using our functions and relationships to plot our graphs, we normally start out by creating a table of values first, and then plotting this pairs of values onto a Cartesian plane (in grade 9 in South Africa). This is why it is so important to understand where functions and relationships come from and how they work because they form the basis of our knowledge about graphs.
But, before we can do that, we also need to be able to draw a graph of a general idea of the function or relationship.
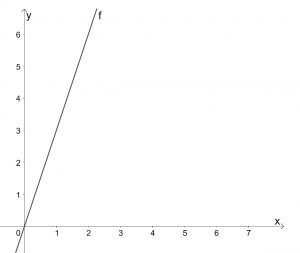
For example, our relationship is given by the equation y = 3x.
From the equation we can see that the y value will always be 3 times as big as the x value. When we draw the graph, this should be obvious. We can also see that as x gets bigger, so does our y value, this means that we have an increasing graph.
Here is the graph:
You can see that for every 1 unit the graph moves right, the graph moves up 3 units. Or in other words, when x=1 then y = 3, or when x = 2[/katex/ then y = 6 and so on.
Where else do we find functions and relationships?
We can find functions and relationships in many different places in maths. Patterns are also a relationship or function. Your term position (the place where you are in your pattern usually represented by n) is your input value, and the actual value of the pattern (usually represented by T) is your output value. With patterns you are also trying to figure out what the relationship between the two values is, and how the input value changes the output value.
Functions and relationships are also found in algebra. When we are solving algebraic expressions we are putting in an input value and looking for the output value (usually through substitution). When we are solving an algebraic equation, we have the output value and we are looking for the input value.
When we study the relationship of simple interest and compound interest our input value could be how much money we invest, and our output value would be how much money we received after a certain amount of time.
We can also find functions and relationships in measurement an geometry. In measurement, when we want to find the area or volume of a shape or solid, we need to know the formula (or relationship) between the various sides and measurement. In geometry we can find different angles based on their relationships with different lines.
Functions and Relationships in Real Life:
Think about the different relationships you have with people around you. You may have a mom and dad that help you, or a mom and dad that you want you to be more independent. These relationships affect where you go to school, how you think about who you are and many other things.
When you start working, you may be paid by the hour or by the day. Your input value would be how many hours or days that you worked. The output would be how much money you made at the end of the month (or whatever the pay period is).
There are also many other complex relationships out there. Like biological functions, where a virus or bacterium may survive on a piece of cardboard (or plastic, or door handle and so on) for so many hours based on whether it comes into contact with heat, or sunshine, or antibacterial spray, or someone else hand and so on. In a lab, they grow bacteria on agar plates (which is like a type of special food just for bacteria) and in different conditions to see how well bacteria thrive.
Knowing what you know now, would you be able to give some examples of real life functions?
Want to practice your knowledge about functions and relationships?
Here are various worksheets that I have created for you to use to practice. Each worksheet comes with a fully worked out memo.
Functions and Relationships 1
(suitable for getting the basics right, or grade 7 students just starting out).

 This flow diagram on the left shows our input values (1, 2, and 3) and an empty box. On the right it shows the output values (10, 20 and 30).
Can you figure out what was done to the input values to get the output values?
That's right, we multiplied each input value by 10. This step of multiplying by the value of 10 would be considered our function. So we could write it into our box like this:
This flow diagram on the left shows our input values (1, 2, and 3) and an empty box. On the right it shows the output values (10, 20 and 30).
Can you figure out what was done to the input values to get the output values?
That's right, we multiplied each input value by 10. This step of multiplying by the value of 10 would be considered our function. So we could write it into our box like this:
 You can see that for every 1 unit the graph moves right, the graph moves up 3 units. Or in other words, when x=1 then y = 3, or when x = 2[/katex/ then y = 6 and so on.